Day Trading Guide for December 5, 2025: Intraday supports, resistances for Nifty50 stocks
The Day Trading Guide for December 5, 2025: Intraday supports, resistances for Nifty50 stocks starts with one crucial fact: you are trading on a live event day. The Indian stock market is watching the RBI monetary policy closely, and the Nifty 50 is hovering just above the 26,000 mark with a cautious tone as traders wait for clues on interest rates and liquidity.
On such a day, blindly following tips is dangerous. You need a structured intraday trading framework built around support and resistance levels, real-time price action, and disciplined risk management. This guide is designed to help you prepare for 5 December 2025 specifically, while also giving you a repeatable approach you can use on any future trading day.
We will walk through the broader context of the Indian stock market, how to read Nifty 50 and its constituent stocks, how to derive intraday supports and resistances, and how to trade them with clear rules. By the end, you will have a practical process instead of a random list of numbers.
Market context for Nifty50 on 5 December 2025
5 December 2025 is not just another Friday on Dalal Street. The Nifty 50 index opened marginally above the 26,000 zone, with traders staying cautious ahead of the RBI’s policy outcome. Early trade has been largely range-bound, reflecting a “wait and watch” attitude rather than aggressive trend-following. In early trade, news flow highlights:
A flat to mildly positive open on Nifty50, around the 26,000 handle. Stock-specific moves in frontline names like Reliance Industries and Tata Steel, which can influence both the index and sector sentiment. This environment typically favours intraday trading approaches that: Respect important support and resistance levels on the index and key constituents. Focus on mean-reversion trades around well-defined zones when the market is sideways. Stay ready for breakout trades if RBI commentary triggers a strong directional move.
Because the Nifty 50 represents large-cap leaders across multiple sectors and covers more than half of NSE’s free-float market cap, its behaviour tends to reflect broader institutional sentiment rather than just retail activity. For intraday traders, this means you should treat Nifty50 levels as “anchor zones” when you trade individual index stocks.
Understanding Nifty50 and why intraday levels matter
The Nifty 50 is a free-float, market-cap-weighted index of 50 large Indian companies listed on the National Stock Exchange (NSE). It spans major sectors like banking, IT, oil & gas, FMCG, auto, and metals, and is widely used as the benchmark for index funds, ETFs, and index futures and options. For a day trader, this has several consequences:
First, Nifty50 intraday support and resistance levels reflect what big money is doing. Breaks or bounces at those zones are often driven by institutions, not just retail trades. Second, Nifty50 futures and options are highly liquid. That liquidity makes levels such as previous day’s high and low, VWAP, and pivot points very relevant, because many strategies and algorithms reference them.
Third, most Nifty50 stocks are heavily traded and closely tied to the index. When Nifty50 turns at a key level, you often see synchronised reactions in banking, IT, auto, and other heavyweight sectors. This is why a Day Trading Guide for December 5, 2025 must start with a clear level framework, not just opinions about the RBI or global cues.
How intraday supports and resistances are built
To trade intraday supports and resistances for Nifty50 stocks, you should rely on a consistent rule set rather than guesswork. The following concepts are core to most professional technical analysis frameworks.
Previous day’s high, low, and close
The simplest, most respected levels on any liquid instrument are the previous day’s high, previous day’s low, and previous close. These levels: Mark where buyers and sellers “won” or “lost” control in the previous session. Act as important supply and demand zones where traders trail stops or initiate fresh positions. Often create intraday trading ranges for the current day. For Nifty50 intraday trading, you would mark: Yesterday’s high and low on the index chart. Yesterday’s high and low on key index stocks you plan to trade. When price re-tests these zones on 5 Dec 2025, you watch how price action behaves: does it reject and reverse, or break with strong volume?
Pivot points and calculated levels
Pivot points are a classic tool for day traders to estimate potential support and resistance levels based on the previous day’s price data. The standard formula uses the prior day’s high, low, and close to derive:
- A central pivot (P).
- Multiple support levels (S1, S2, S3).
- Multiple resistance levels (R1, R2, R3).
Though they are derived formulas, many intraday traders and automated systems watch these levels, which can create self-fulfilling reactions. Combining pivot points with price action and volume gives you more confidence in your intraday setup.
VWAP and volume-based levels
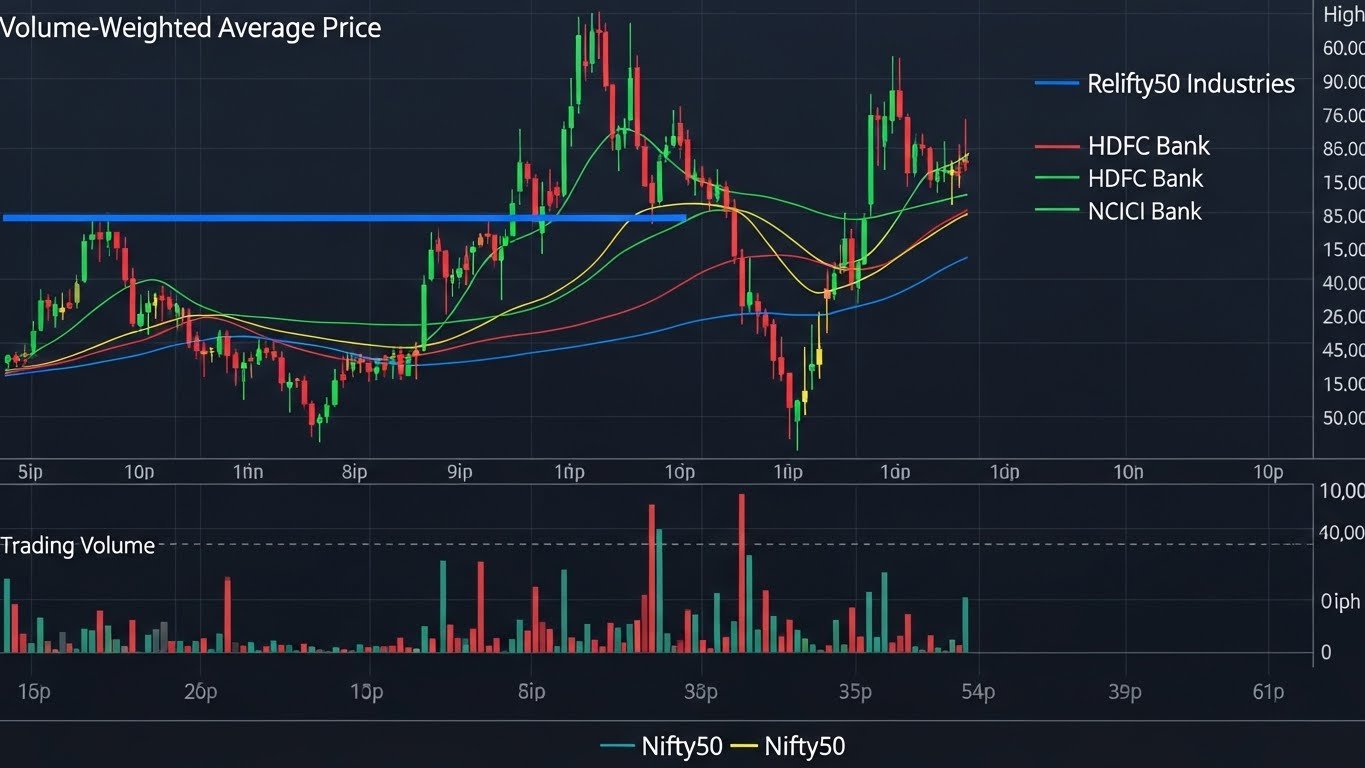
The Volume Weighted Average Price (VWAP) is a core tool for institutional and professional traders. It tells you the average price at which the instrument has traded, weighted by volume, for the current day. On 5 Dec 2025, with the market reacting to RBI policy expectations, the Nifty50 VWAP and VWAP of heavyweights like banks, IT, and energy names will often: Act as a dynamic intraday support or resistance line. Indicate whether institutions are net buying above VWAP (bullish) or selling below (bearish). For Nifty50 stocks, repeated bounces off VWAP with strong volume show accumulation, while repeated rejections signal distribution.
Psychological round numbers
Round numbers like 26,000 on Nifty 50 or neat price points like 1000, 1500, 2000 on popular stocks tend to attract orders. Traders place stop loss orders, take profits, and scale in or out around these zones. On 5 December 2025, the 26,000 zone itself is a major psychological reference for Nifty. If the index holds above this level, intraday traders may favour long setups on dips towards support; if it breaks and sustains below, short setups in weaker stocks may dominate.
Step-by-step day trading roadmap for 5 December 2025
Pre-market preparation
Before the opening bell, your day trading guide should include: Reviewing the overnight global cues and the RBI expectations. Plotting previous day’s high, low, and close for the Nifty 50 index. Marking important support and resistance levels for 8–10 liquid Nifty50 names you actively trade (for example, large banks, IT majors, and key sector leaders). Identifying stocks in news and stocks near major technical levels. Because 5 Dec 2025 is an event-driven day, you also want a clear plan for position sizing, keeping risk per trade small and avoiding over-leverage in index futures or options.
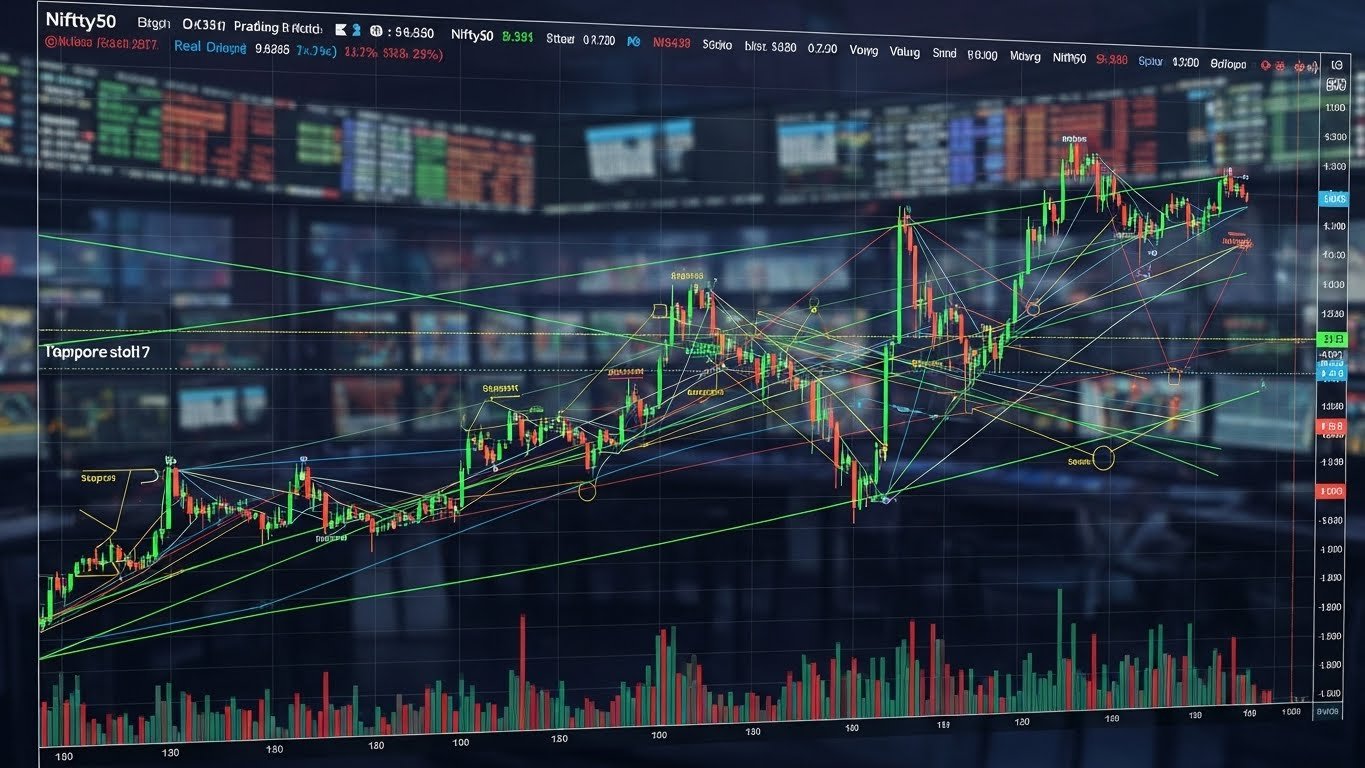
First 30–45 minutes: map the intraday range
In the opening 30–45 minutes, focus on price discovery, not instant profits. Your job is to identify: Where the opening range high and low settle on Nifty50. Whether the index respects or immediately violates yesterday’s support and resistance zones. Which Nifty50 stocks display relative strength or weakness compared to the index.
A stock that breaks above both its opening range high and previous day’s high, with rising volume and holding above VWAP, becomes a candidate for trend-following longs. On the other hand, a stock that fails at resistance levels and trades below VWAP can be a short candidate.
Mid-session: trade the supports and resistances, not your opinions
Once the market has settled into a range, many opportunities come from trading re-tests of key levels and using mean-reversion or breakout tactics.
For example:
If Nifty50 dips towards a confluence of support levels such as yesterday’s low plus a pivot support (say S1), and price shows strong buying wicks and a bounce back above VWAP, you have a potential long setup with a tight stop below the low. If Nifty50 rallies into a zone where yesterday’s high, R1, and a psychological number (like 26,100 or 26,200) cluster together, and price forms reversal candles with falling volume, you have a potential short setup with a stop above the high. The same principle applies to Nifty50 stocks: the more confluence of technical analysis factors at a level, the more meaningful the intraday support or resistance.
Around RBI policy time: volatility management
On 5 December 2025, the RBI policy announcement is the main scheduled event. Just before the announcement: Many professional traders flatten or reduce risk. Options implied volatility tends to be elevated.Whipsaws can become vicious around intraday levels. A practical day trading guide here would stress:
Avoid initiating fresh large positions immediately before the policy. If you choose to trade the reaction, use smaller size and wider stop loss. Let the first 5–10 minutes after the announcement shape a new short-term range before you commit heavily. During this phase, support and resistance levels may temporarily “break” and re-form as the market digests new information. Treat early spikes with caution and wait for clear price structure to emerge.
Last hour: trend continuation or reversal setups
In the final hour of trade, patterns often become clearer:
If the index has trended all afternoon, you look for trend continuation setups using pullbacks to VWAP or prior intraday swing levels. If the index has been range-bound, you may see false breakouts or quick reversals near range boundaries as traders square off positions. On event days, the last hour can show strong institutional order flow. Watch how Nifty50 behaves around the day’s intraday high and low, as well as major support and resistance zones plotted earlier.
Finding intraday supports and resistances for Nifty50 stocks
The title of this guide is focused on “intraday supports, resistances for Nifty50 stocks,” which means you are not just trading the index, but also stock-specific moves. Here is a structured way to find levels for individual names.
Use multi-timeframe technical analysis
Start with a daily chart for each stock to mark: Key swing highs and lows from the past few weeks.Major trendline supports and resistances. Important moving averages such as 20-day and 50-day, which often act as dynamic support or resistance in large-cap stocks. Then drop to the 15-minute or 5-minute chart to refine: Yesterday’s intraday high, low, and close. The first hour’s high and low. Local swing points that line up with daily-level zones. This multi-timeframe approach ensures that your intraday trading levels are not random; they are derived from both short-term and higher timeframe price action.
Combine VWAP with previous structure
On 5 Dec 2025, as the session evolves, calculate and display VWAP on your intraday charts. For each Nifty50 stock you track: A bounce from VWAP that coincides with a prior support level (for example, yesterday’s low) creates a high-quality long setup. A rejection from VWAP at a prior resistance level (such as yesterday’s high) strengthens a short setup. By combining VWAP, pivot points, and previous highs/lows, you convert raw prices into a coherent support and resistance map for each stock.
Watch sector leaders and index correlation
Because Nifty50 is sector-diversified, sector rotation is common. On an RBI policy day: Banking and financials might show larger moves. Interest-rate-sensitive sectors (like autos or real estate) may react more sharply. When Nifty Bank and large private banks lead the move, stocks like HDFC Bank, ICICI Bank, or Axis Bank may break or hold specific intraday supports and resistances in sync with the index. Aligning your stock trades with the broader index trend and sector behaviour usually improves probability and reduces false signals.
Risk management for Nifty50 intraday trading
Even the best Day Trading Guide for December 5, 2025 is useless without solid risk management. On a volatile event day, traders often lose more from impulsive sizing than from bad levels. A sensible approach includes: Defining your per-trade risk as a small percentage of your trading capital. Placing your stop loss beyond meaningful support or resistance, not just a random number. Avoiding over-concentration in a single theme, such as being long or short all banks at once. Limiting the total number of trades; overtrading reduces your ability to focus on high-quality setups at key levels. Remember, intraday trading is a game of surviving long enough to let your statistical edge play out. Protecting capital on 5 Dec 2025 is more important than catching every move.
Trading psychology and execution discipline
On days like 5 December 2025, where Nifty50 hovers near important psychological zones and fundamental news can hit any moment, trading psychology is as vital as your chart levels. Key mental rules include:
Staying flexible. A level is a zone, not an exact tick. Let price action confirm the trade. Avoiding revenge trading when a breakout fails at a resistance level or a support cracks unexpectedly. Accepting that missing a move is better than blowing up an account. Consistently following your plan—plotting intraday supports and resistances, respecting stop losses, and aligning trades with the overall market context—is what eventually separates profitable day traders from hopeful gamblers.
Conclusion
The Day Trading Guide for December 5, 2025: Intraday supports, resistances for Nifty50 stocks is not meant to be a list of magic numbers. Markets around RBI policy days are dynamic, and exact levels can be tested, broken, and reclaimed multiple times. Instead, this guide gives you a repeatable, professional-style process: Begin with the big picture: Nifty50 near 26,000, RBI in focus, cautious sentiment. Map daily and intraday support and resistance levels for both the index and key stocks. Use tools like VWAP, pivot points, and price action to refine entries and exits. Practice strict risk management and maintain a resilient trading psychology. If you combine this framework with continuous learning, detailed journaling of your trades, and regular review of what worked or failed, you will be far better prepared not just for 5 December 2025, but for every trading day that follows.
FAQs
Q: What are the most important Nifty50 levels to watch on 5 December 2025?
The most important levels are usually the previous day’s high and low, the opening range high and low, the central pivot and nearby supports/resistances, and the VWAP for the current session. For Nifty50 stocks, you mirror this by tracking their individual highs, lows, and VWAPs, especially when they align with psychological prices or major daily chart zones.
Q: How do I identify high-probability intraday trades on Nifty50 stocks?
High-probability setups often occur where multiple factors converge: for example, a stock bouncing from previous day’s low that also coincides with a pivot support level and VWAP, while the Nifty 50 index itself holds above a key support. Add strong volume and clear price action rejection candles, and you have a more reliable trade than a random breakout attempt.
Q: Is it safe to trade during the RBI policy announcement intraday?
Trading during the RBI policy announcement can be profitable but risky. Price often becomes extremely volatile, and support and resistance levels can be temporarily ignored. If you are new to intraday trading, it is usually wiser to reduce position size or sit out the first few minutes, then trade only when a clearer post-announcement structure emerges.
Q: Should I focus on the index or individual Nifty50 stocks for intraday trading?
You do not have to choose one over the other. Many traders use the Nifty50 index as a directional guide and then trade individual Nifty50 stocks that show relative strength or weakness. For example, if the index is holding a strong support and bouncing, you look for stocks outperforming the index near their own support levels. This alignment of index and stock behaviour often improves trade quality.
Q: How many Nifty50 stocks should I track for intraday trading each day?
Instead of trying to track all 50 stocks in detail, most traders do better by focusing on 8–12 names that are liquid, familiar, and often in play (banks, top IT names, large diversified conglomerates, etc.). For these, you can reliably mark intraday supports and resistances, monitor VWAP, and follow price action without getting overwhelmed. Over time, you can adjust this watchlist based on volatility, news, and personal comfort.